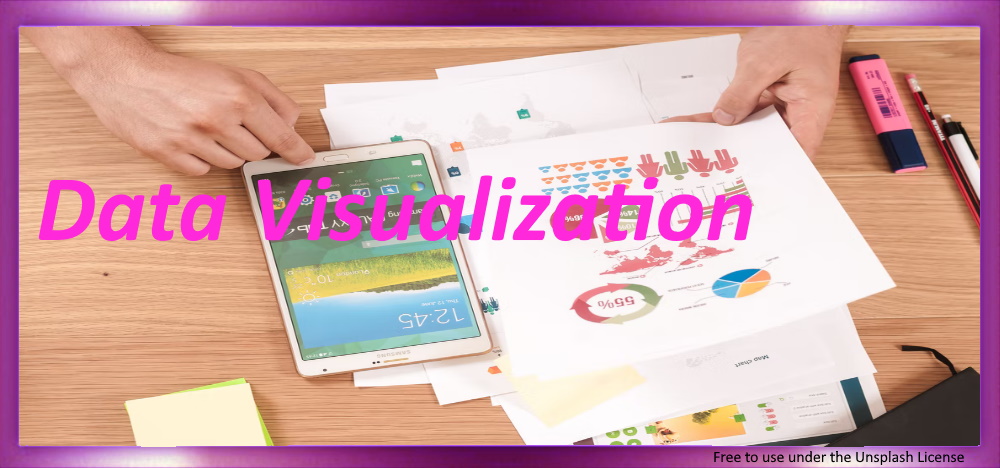
Data Visualization: Turning information into visual narratives
Data visualization is a process of transforming data into visual representations in order to communicate them clearly and effectively. It is about bringing complex information into a schematic form, including attributes or variables for the information units. If you're looking for experts who can turn your numbers into powerful visual narratives, look no further than Leonardo Miljko, Statistical Consultancy and Data Analysis. precisely.
Our primary goal is to communicate information clearly and effectively through graphic means. To do this, our data visualization experts consider both aesthetic form and functionality. Unlike other consultants, we strike a balance between form and function, creating data visualizations that fulfill their primary purpose: to communicate information.
With the support of Statistical Consulting and Data Analysis Leonardo Miljko w. you can gain valuable insights from your data. We help you explore and unlock valuable information hidden in your data. Our experts will help you effectively communicate large amounts of information in a simple and easy-to-understand way. In doing so, we use colors, shapes and images to classify data in related contexts and to arouse the interest of the viewer/reader.
Overall, data visualization is an important step in analyzing data and generating valuable insights. If you need assistance with this process, you can count on experts from Statistical Consulting and Data Analysis Leonardo Miljko Gew. leave.
keywords:
Data visualization, statistical advice, data analysis, Leonardo Miljko, information, visual, graphic means, form, function, connections, colors, shapes, images
meta text:
Learn more about data visualization and how Statistical Consulting and Data Analysis Leonardo Miljko wer. can help you extract valuable information from your data.
"Used Source: ChatGPT"


