Video - Video - How to interpret KMO (Kaiser-Meyer-Olkin test) and Bartlett´s test - EFA (Exploratory Factor Analysis)
Statistische Beratung und Datenanalyse Leonardo Miljko - Statistical Agency
Link: www.StatistischeDatenAnalyse.de Video StatistischeBeratung 1280 x 720 px
How to interpret KMO (Kaiser-Meyer-Olkin test) and Bartlett´s test - EFA (Exploratory Factor Analysis)
"Have you ever pondered over the significance of understanding the Kaiser-Meyer-Olkin measure and Bartlett's test in factor analysis? Let's dive into this intriguing subject. Exploratory Factor Analysis, or EFA, a statistical method, is widely used to understand the structure and patterns in a set of observed variables, by breaking them down into factors. However, it is crucial to assess whether the data is suitable for factor analysis. This is where the KMO measure and Bartlett's test come into play. "
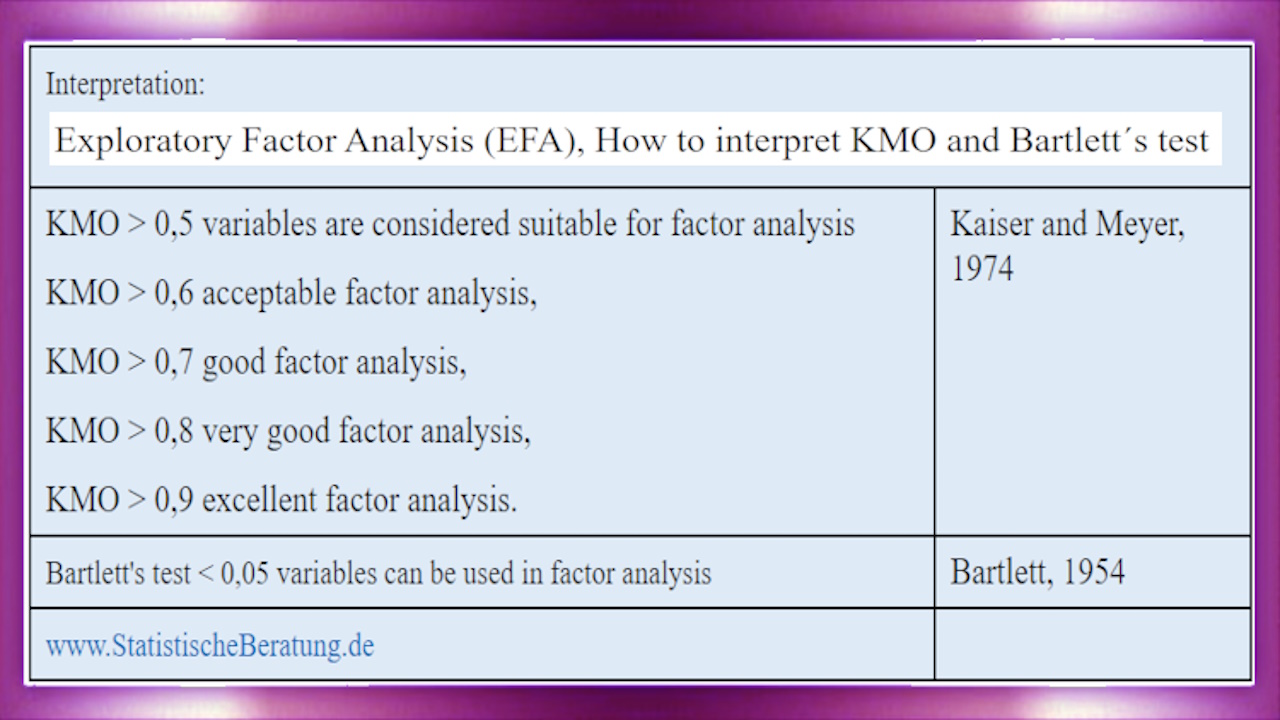
The Kaiser-Meyer-Olkin measure, or KMO, gauges the degree of common variance among the observed variables. In simpler terms, it measures the amount of shared information. The KMO value ranges from zero to one. A KMO value greater than point five indicates that the data is suitable for factor analysis. Breaking it down further, a KMO value greater than point six is deemed acceptable, greater than point seven is good, over point eight is very good and anything above point nine is excellent. These figures provide an indication of the level of shared information among the variables, and thus, the appropriateness of the factor analysis.
On the other hand, Bartlett's test of sphericity assesses the hypothesis of homogeneity in the correlation matrix. In layman's terms, it checks if the variables are sufficiently interrelated to be used in factor analysis. A significant value in Bartlett's test would suggest strong correlations between variables, making them suitable for factor analysis. Specifically, a significance value less than point zero five is considered appropriate.
In short, for a suitable factor analysis, the KMO value should be above point five, indicating a good degree of common variance. Simultaneously, Bartlett's test should yield a significance value less than point zero five, suggesting that the variables are sufficiently interrelated. So, to sum it all up, the KMO measure and Bartlett's test are fundamental to ensuring the suitability of your data for factor analysis. They help in understanding the degree of shared information and interrelation among variables, thus aiding in making more informed and effective decisions. So next time you're delving into factor analysis, remember the importance of these two statistical tests. Thank you for joining in on this journey into the world of factor analysis. Stay curious, keep learning, and until next time, this is www.Statistical.Agency , signing off."


